Know what happens in every store between the door and the till
Follow each visit on the cameras you already have, see who stays and who leaves, and fix the step where the sale is lost.













Why the store numbers no longer add up

More visitors, same sales
Footfall went up. The till did not. Who came in, and who only passed by, is a blank.

One store wins, one loses
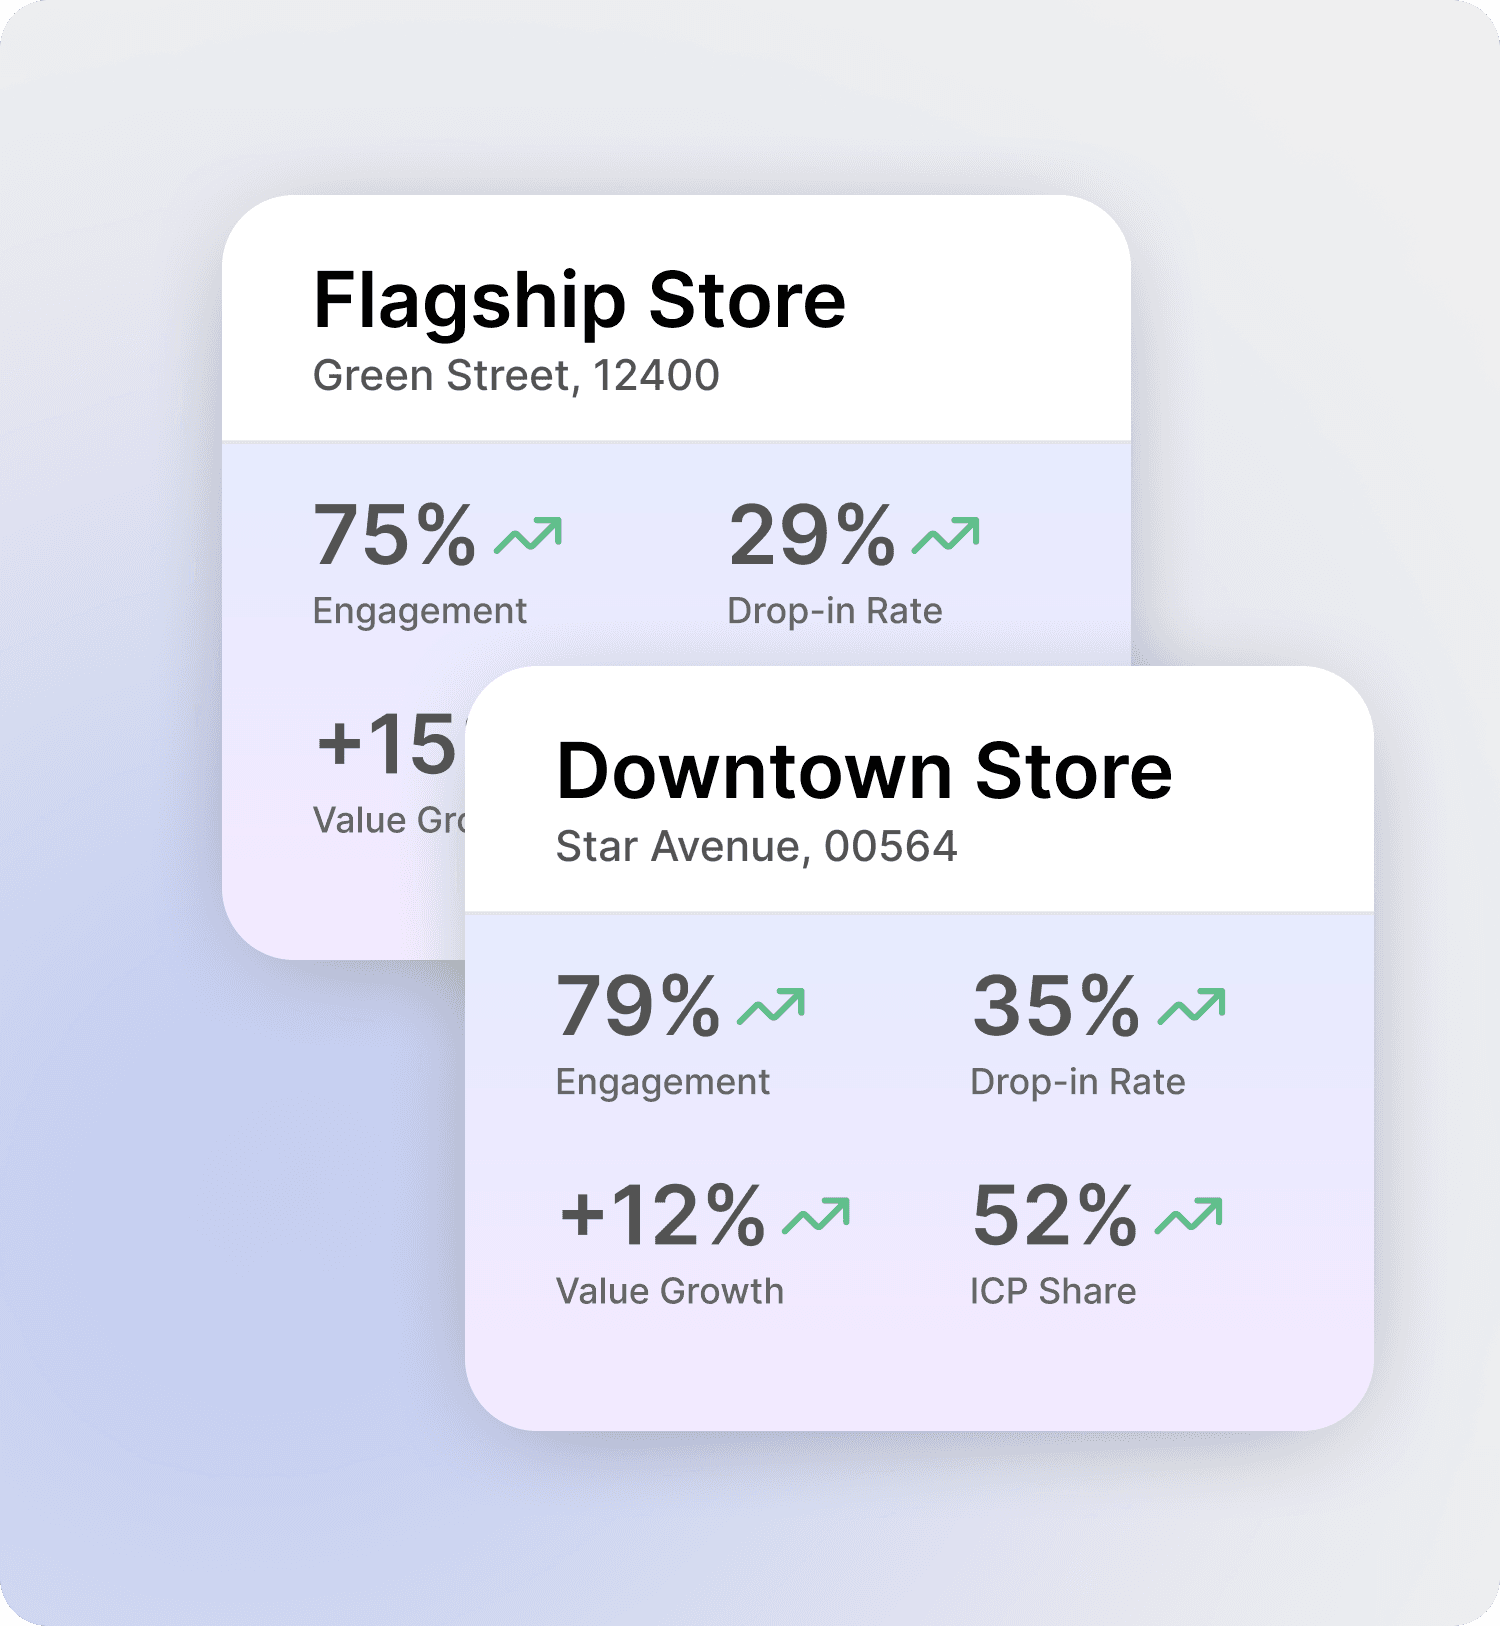
Two stores, the same numbers at the door. One sells more. Nothing shows why, or how to compare.

Changes go unmeasured
New campaign, new layout, new window. What each one did to sales is anyone’s guess.
CAPABILITIES
Turn more visits into sales in every store you run
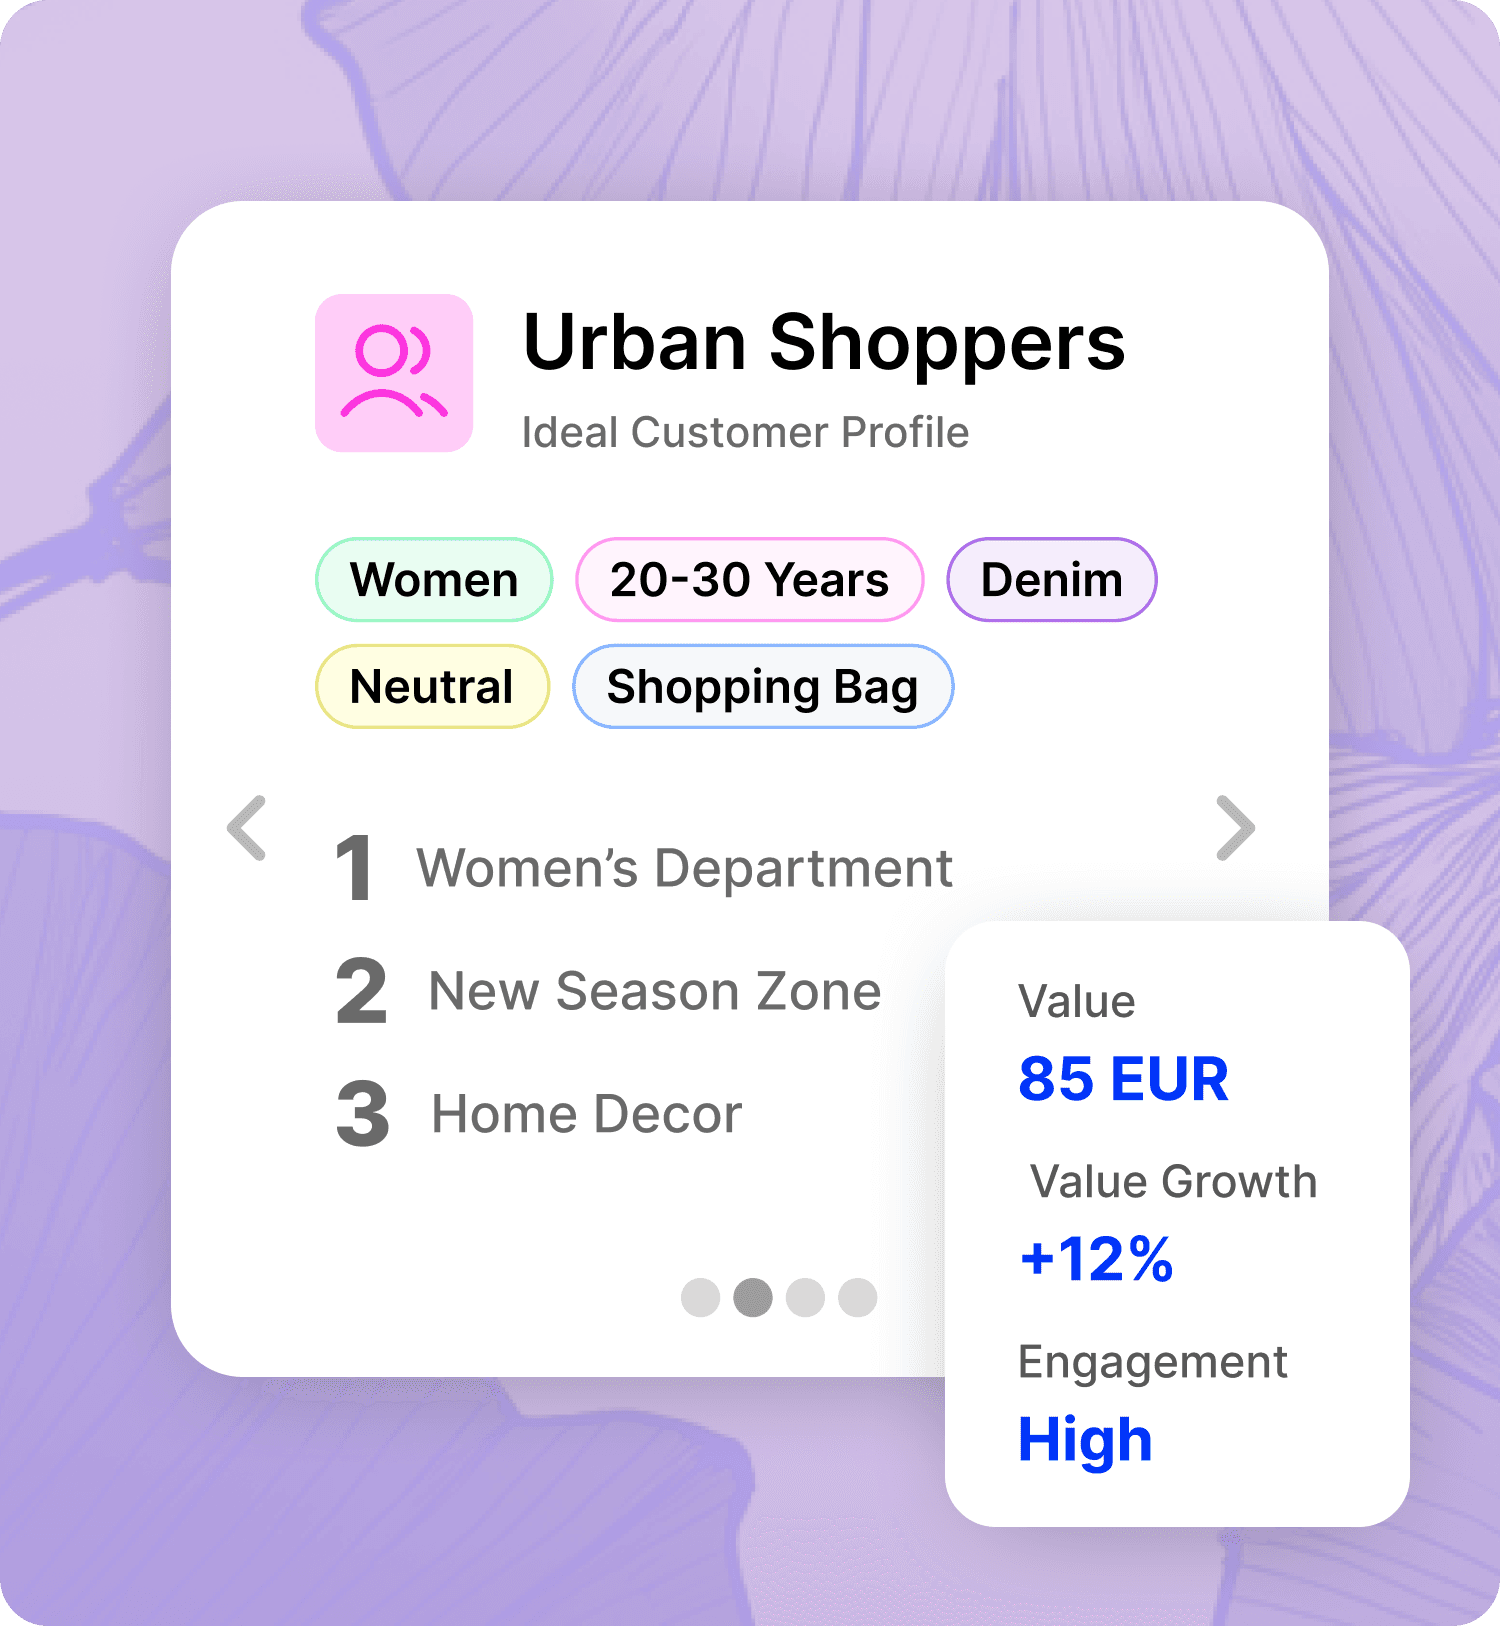


Run every store on numbers you can verify
Published accuracy per site, anonymisation with a published policy, and every change measured against a forecast. On the cameras you already have, monitored around the clock.
Accuracy you can check. 97.5%+ in 99 of 100 deployments, published.
Whole journeys, nobody identified. Patented anonymization.
Analysis done before you ask. Iris reads your data overnight.
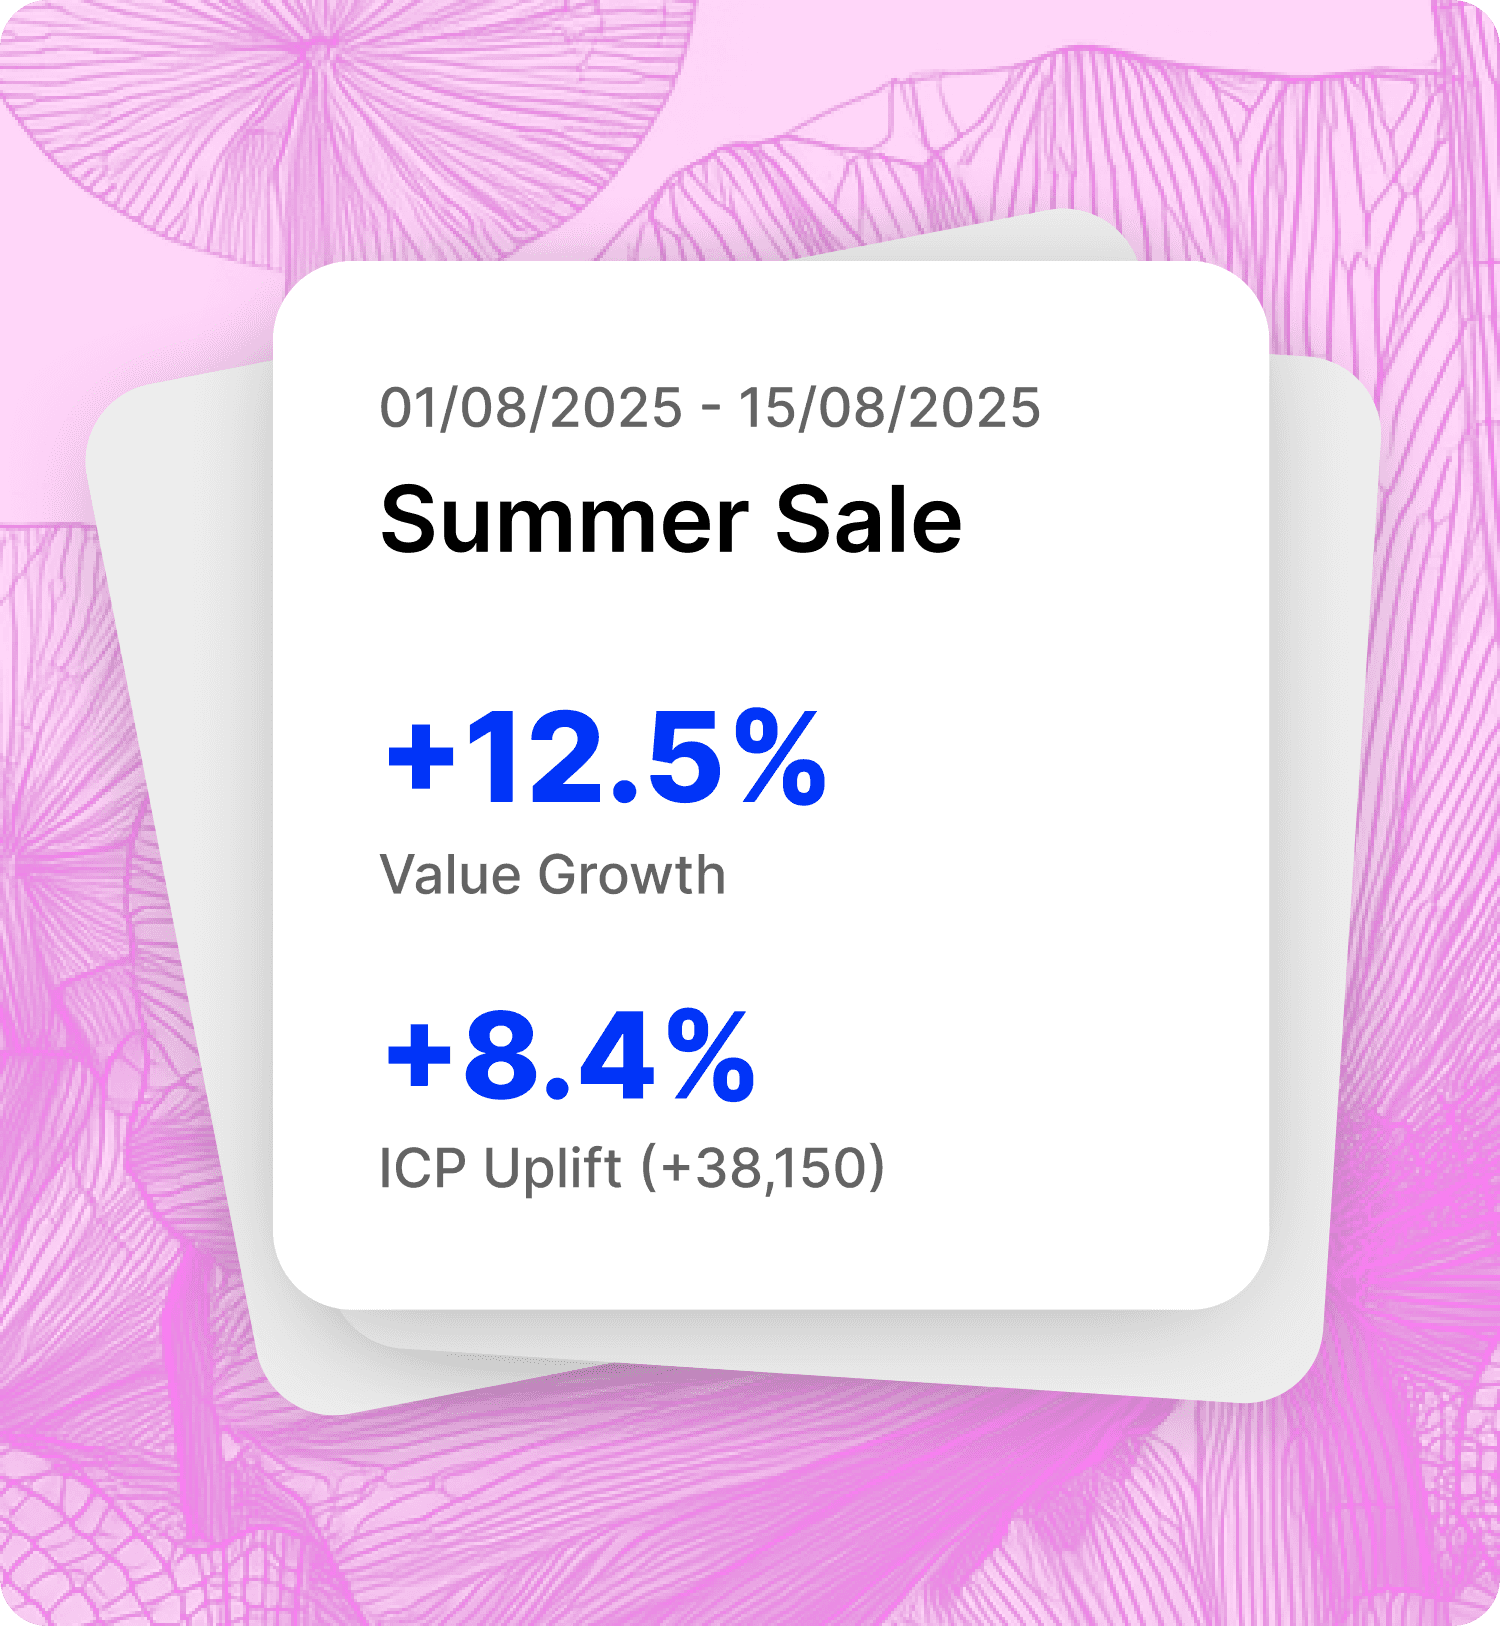
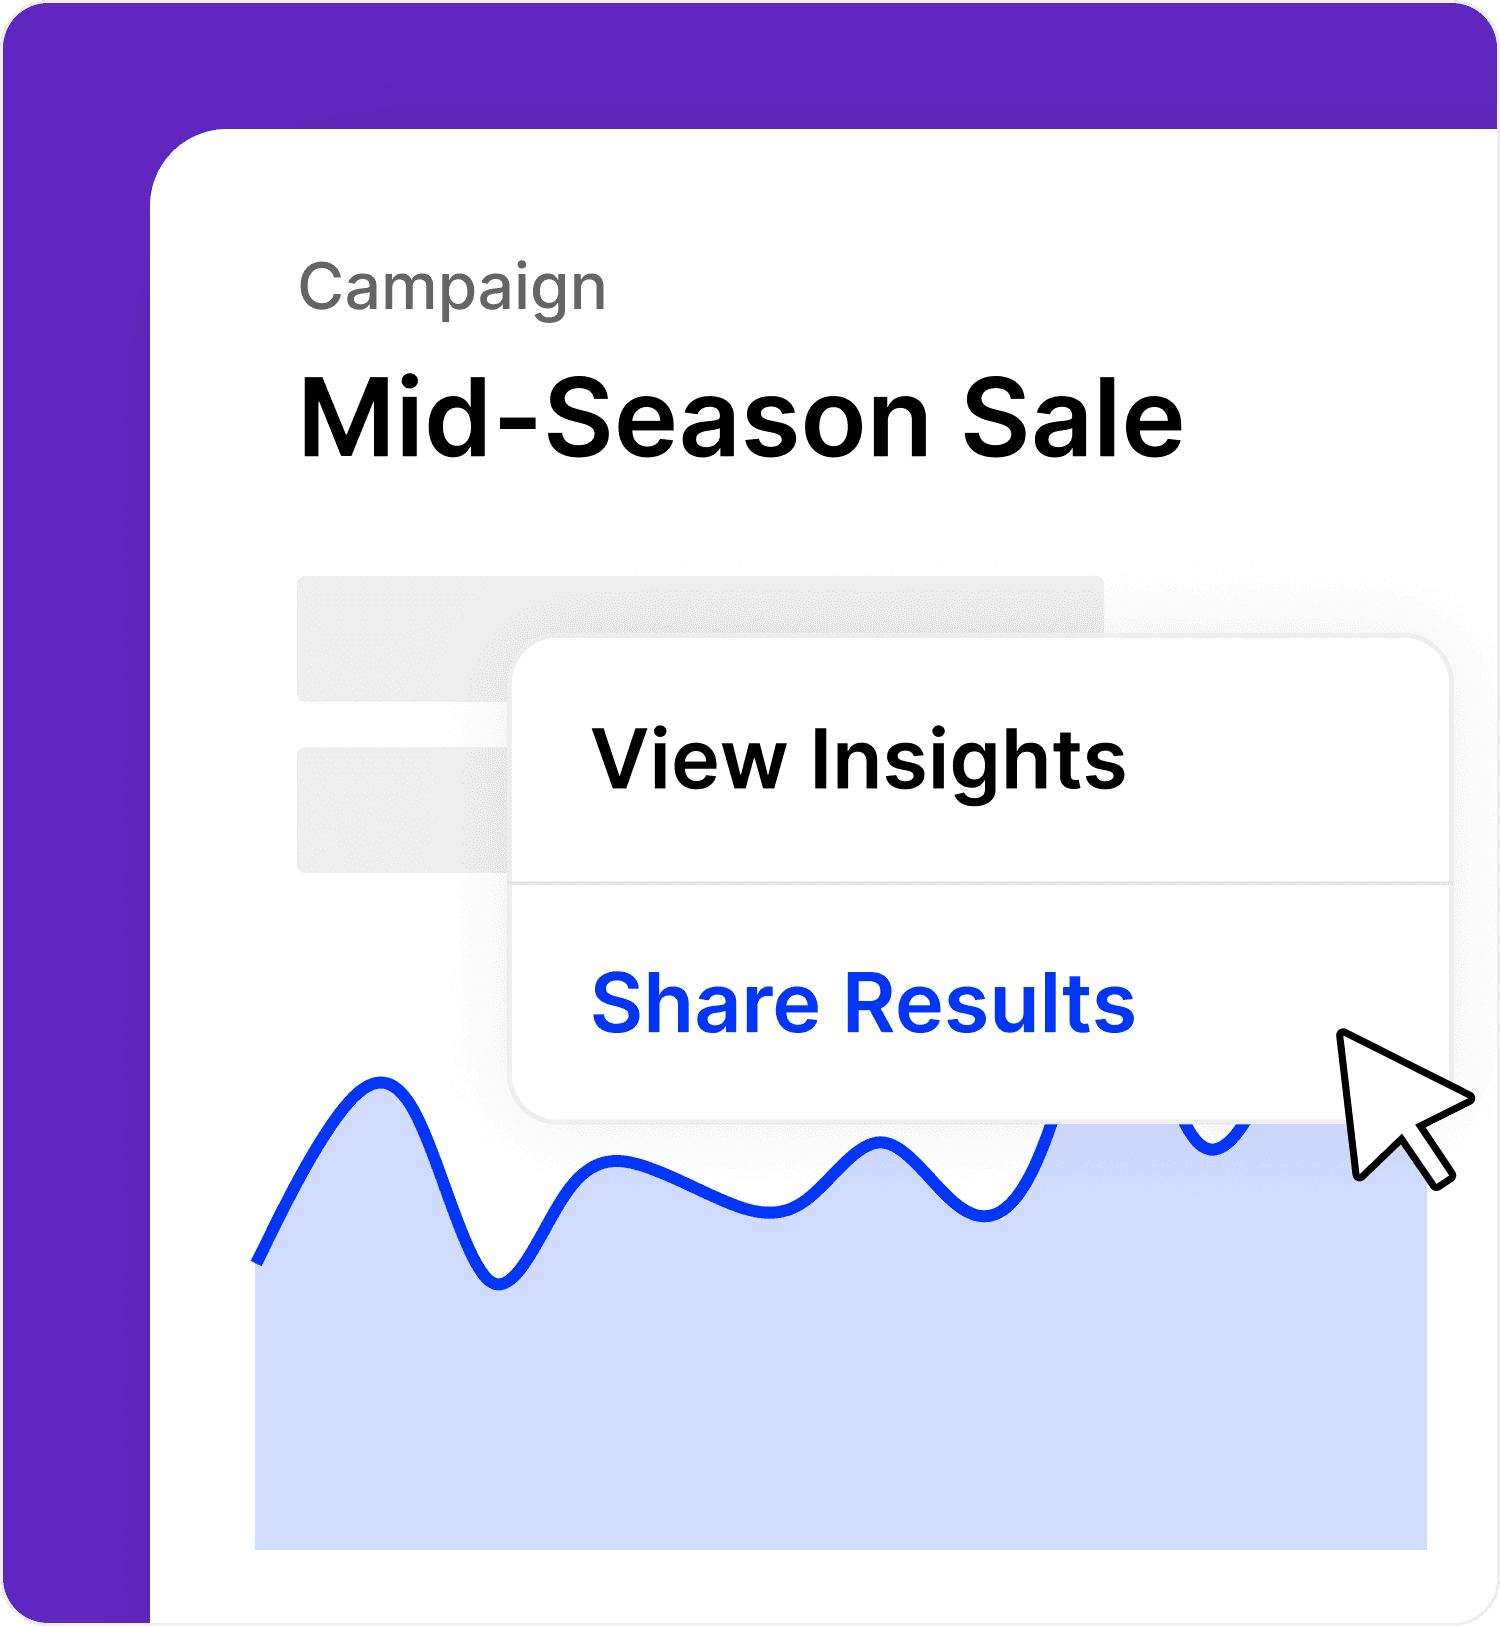
Every change measured. Act reads each change against forecast.
Your AI can ask the data too. MCP server, the same one Iris uses.

INTEGRATIONS
Feed your BI and your AI
Pull it into your BI, push it to your systems, or let your own AI ask.
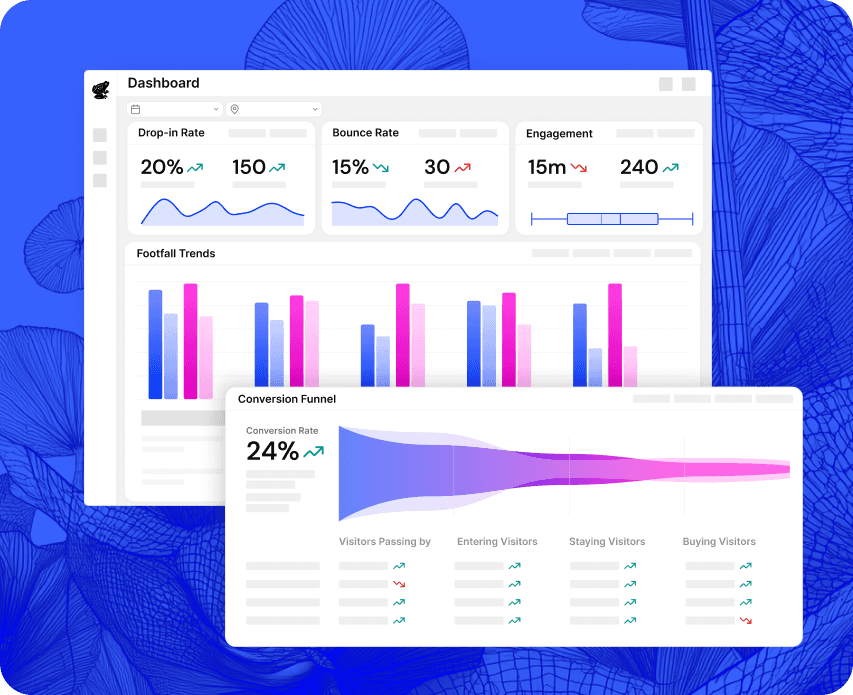
Lands in your BI. Every metric into Power BI, Qlik or Snowflake, by the hour.
Speaks your IDs. Stores, zones and cameras mapped to the IDs you already use.
Pushed when you need it. Real time, aggregated or scheduled, to POS, CRM or BI.
Open to your AI. The MCP server behind Iris answers your own AI tools too.