
Indivd
•
•
Intro
A seven-part framework for connecting foot traffic analytics to retail decisions, diagnosing where customer journeys break and improving marketing, merchandising and staffing across your stores.
People counting should do more than tell you how many people entered a store.
The real value of foot traffic analytics is in the decisions it improves: where to focus marketing, how to adjust a layout, when to schedule staff, and whether a store change actually worked.
This guide covers seven decisions that matter in almost every physical retail business—and the measurements that help teams make them with confidence.
Key takeaways
A door count tells you how many people entered, but not who engaged or why they left.
Conversion is more useful when you understand who had a realistic chance of buying.
Zone visits, dwell time, product interaction, and journey drop-off reveal what happens between the entrance and the till.
Staffing should reflect when valuable demand appears, not only when the store is busiest.
Every campaign, layout change, and fixture move should be measured against a clear baseline.
Any vendor accuracy claim should come with a defined scope, testing method, and evidence.
Why footfall alone is not enough
A store is not run on everything that can be measured. It is run on decisions.
That distinction matters because two days with the same entrance count can produce very different outcomes. One may bring in shoppers with strong purchase intent. The other may include more companions, casual visitors, or people who leave almost immediately. A door counter records both days in the same way.
The useful question is therefore not simply, “How many people came in?” It is:
Did the store attract the right demand, create engagement, and convert that demand into value?
Answering it requires context around the count:
How many people passed the storefront?
How many entered?
How many left almost immediately?
How many engaged with the store?
How many matched the retailer’s defined target audience?
What did visitors do before they bought or left?
These signals turn footfall from a reporting metric into an operating tool.
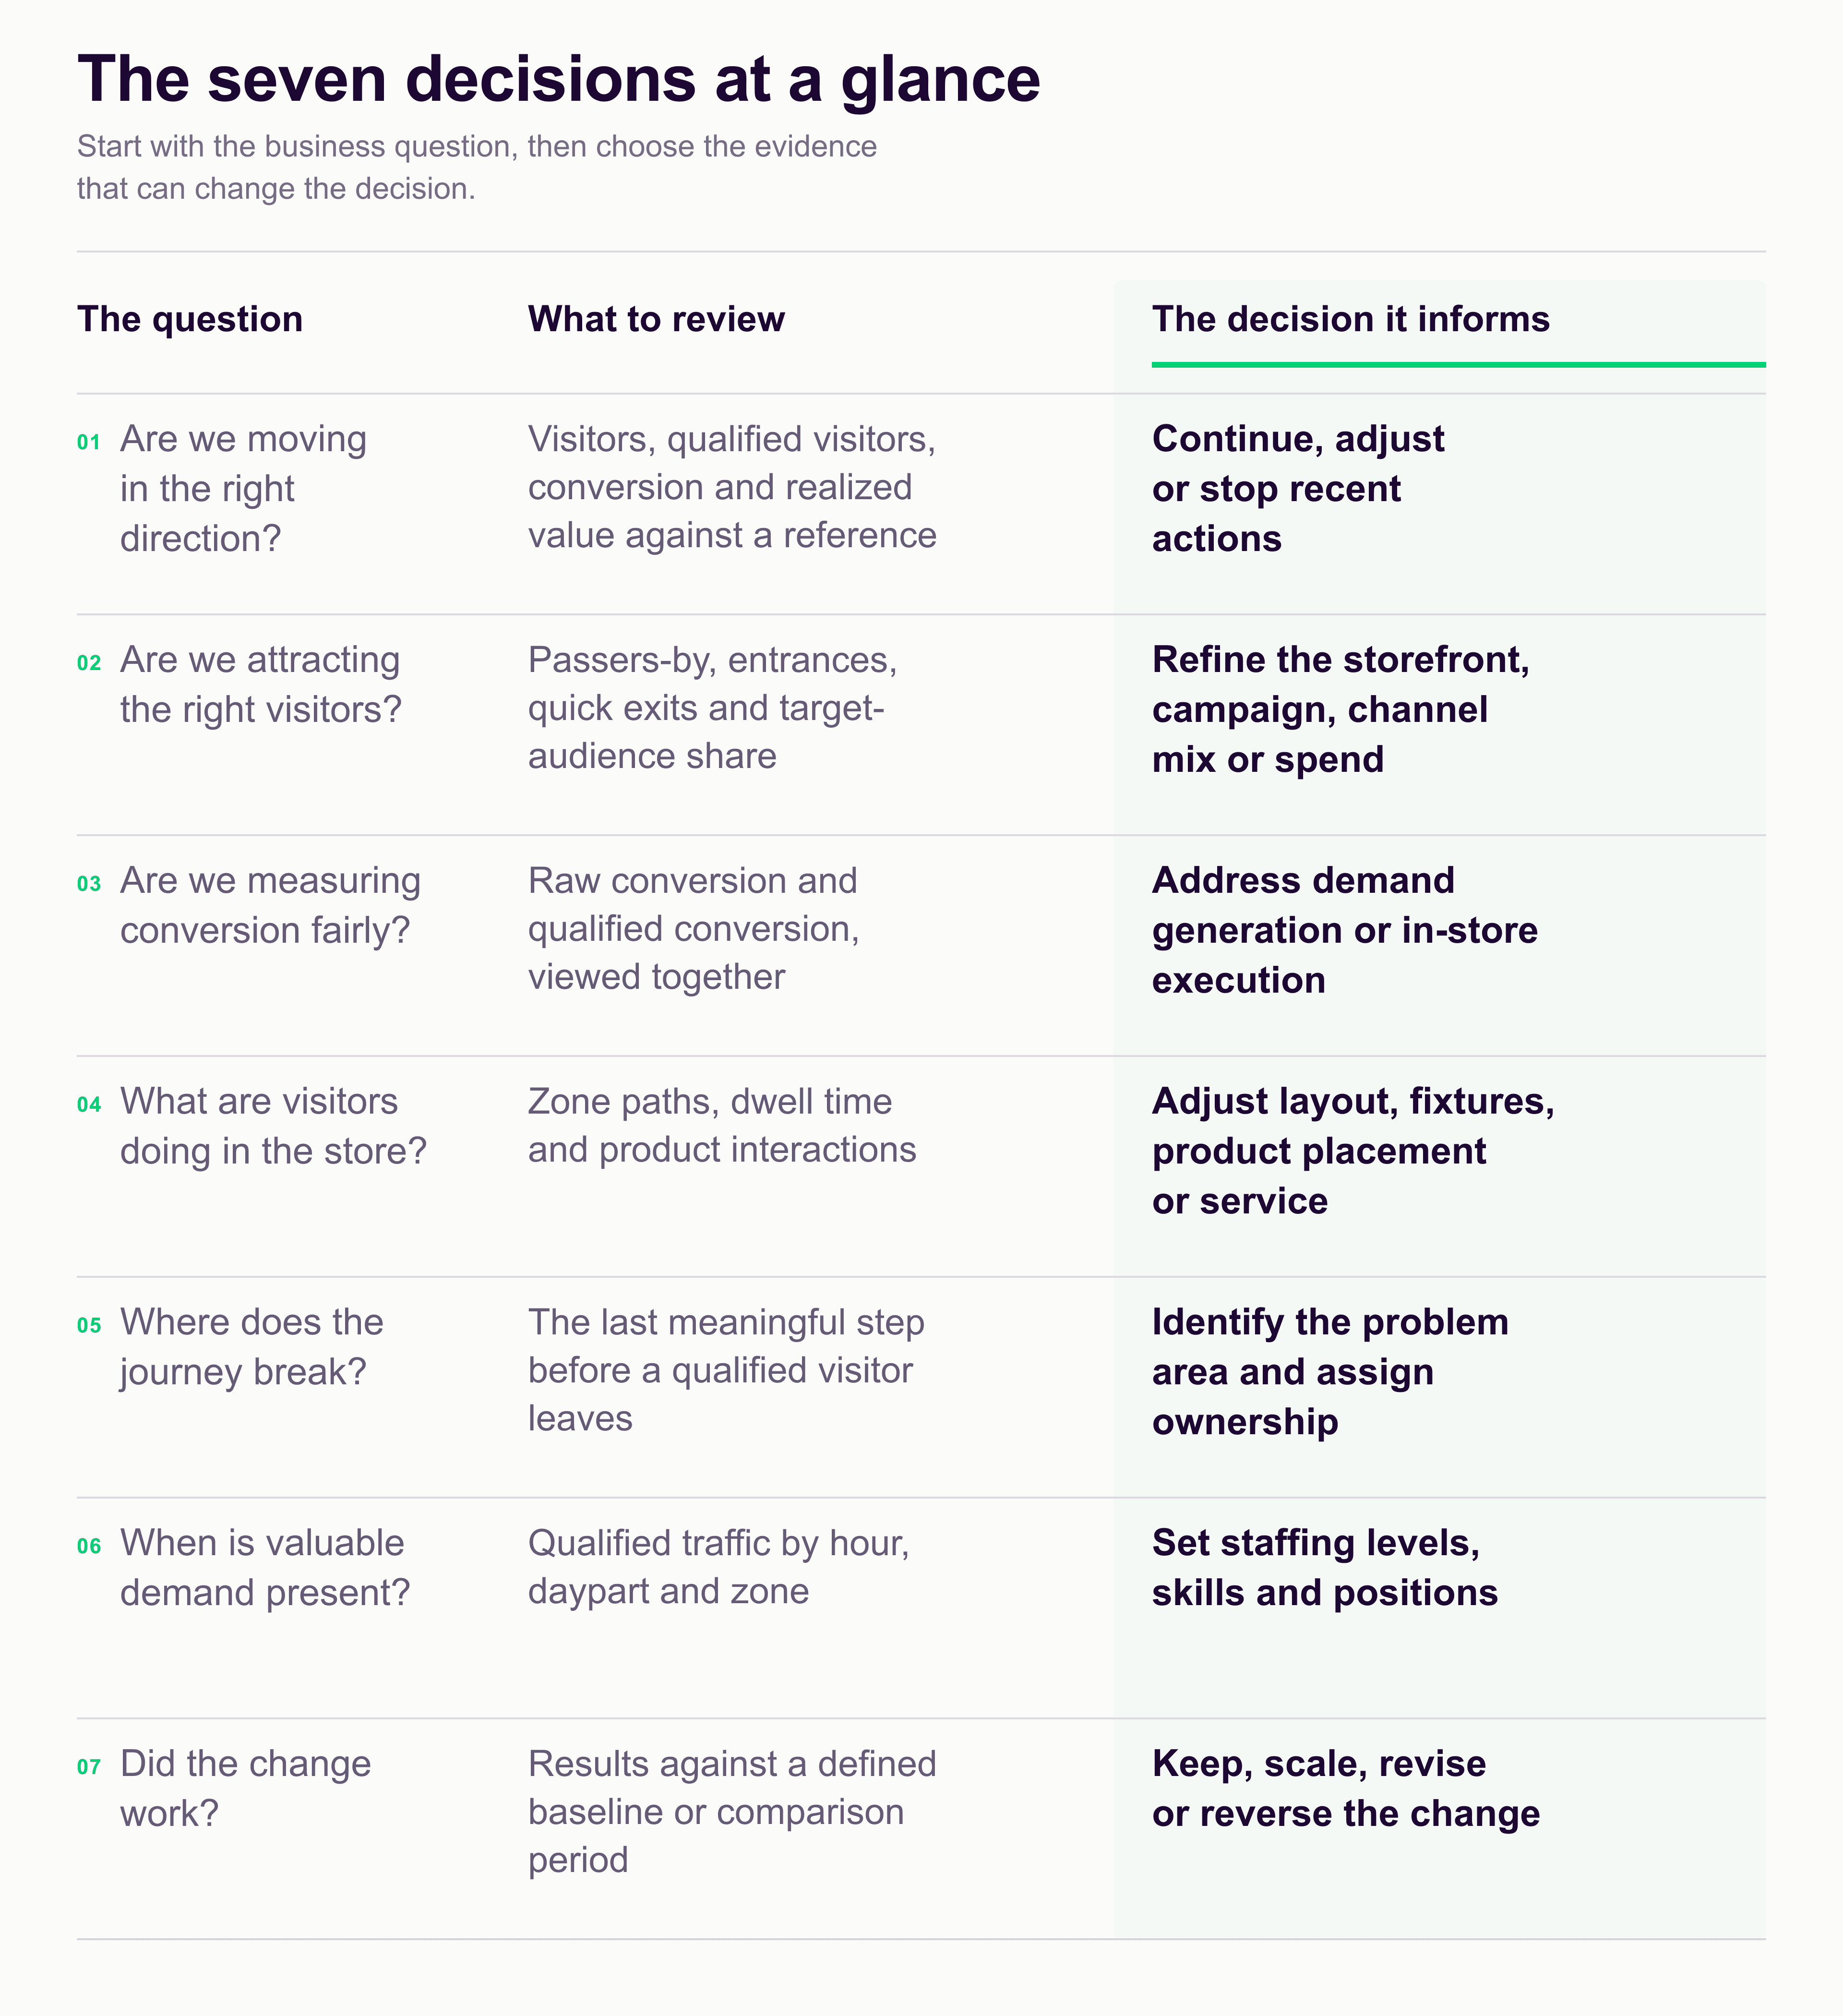
Are we moving in the right direction?
Retail leaders first need a clear view of direction: are results improving, declining, or holding steady?
A useful weekly view places four measures side by side:
visitors;
qualified visitors;
conversion;
realized value, such as revenue or another agreed commercial outcome.
Compare each measure with the previous period and a relevant reference, such as the same weekday, a rolling average, or the same period last year.
Together, the measures explain more than any one of them can. If total traffic rises but qualified traffic stays flat, the issue may sit with demand generation rather than store execution. If traffic surges and the raw conversion rate falls, the store may still have converted its relevant visitors well.
DECISION IMPROVED
Whether last week’s actions should be continued, adjusted, or stopped.
Are we attracting the right visitors?
Raw footfall rewards volume. Retail strategy usually depends on relevance.
To understand whether a store is attracting the audience it was designed for, separate:
passers-by from entrants;
quick exits from engaged visits;
total visitors from the retailer’s clearly defined target audience.
This makes it possible to evaluate each part of demand generation fairly. Storefront performance can be judged by the share of passers-by who enter. The first impression can be assessed through quick exits. Campaigns and location strategy can be evaluated by whether they attract the intended audience, not only a larger crowd.
Any audience classification must be used within applicable privacy rules and supported by transparent, privacy-preserving data practices.
DECISION IMPROVED
Where to aim the storefront, campaign message, channel mix, and marketing spend.
Are we measuring conversion fairly?
The standard retail conversion formula is:
Transactions ÷ entrances
It is useful, but it can hide important context. On a busy day, entrances may include casual browsers, companions, and visitors outside the store’s intended audience. That larger denominator can make conversion appear weaker even when sales increase and relevant visitors convert well.
Keep the standard rate, but place it beside a second measure:
Transactions ÷ qualified visitors
Here, “qualified” must have a clear, consistent definition based on the retailer’s goals and the capabilities of the measurement system.
The gap between raw and qualified conversion can improve diagnosis. A weak raw rate paired with a strong qualified rate may point to an attraction issue rather than an in-store sales issue.
DECISION IMPROVED
Whether the next intervention belongs in marketing, merchandising, service, or store operations.
What do visitors do inside the store?
The door count cannot explain what happens between entry and checkout. Zone-level data can.
Focus on three measurements:
Zones visited and visit order: Shows the paths shoppers actually take, rather than the path intended by the floor plan.
Dwell time by zone: Distinguishes areas that hold attention from areas people simply pass through.
Product interaction by zone: Shows whether visitors stop, explore, and handle products where engagement matters.
Imagine that the intended audience regularly enters a high-priority zone but rarely interacts with its products. A sales report may show disappointing performance, but it will not explain whether the problem is range, placement, presentation, or service. In-store behavior narrows the question.
DECISION IMPROVED
Which fixtures, displays, product placements, and service moments should change.
Where does the customer journey break?
Store-level conversion tells you that some visits did not end in a purchase. It does not tell you where the opportunity was lost.
Journey analysis can reveal whether visitors reached a fitting room, a high-value department, a service point, or none of them before leaving. This separates two problems that can look identical in a sales report:
The right visitors reach a zone but do not convert.
A zone converts well, but too few relevant visitors reach it.
The first may be a range, presentation, availability, or service problem. The second may be a traffic-flow, demand-generation, or store-promise problem.
DECISION IMPROVED
Where ownership of the fix belongs and which change to prioritize.
Are we staffing for the right demand?
Staffing to raw traffic helps teams prepare for busy periods. But the busiest hour is not always the most commercially important hour.
Add hourly and daypart views of qualified traffic, including when the intended audience appears in specific zones. This may reveal periods when overall traffic is moderate but high-potential demand is concentrated.
That insight can influence not only how many people are scheduled, but where particular skills are needed. This could include fitting-room support, product expertise, or checkout capacity.
DECISION IMPROVED
When and where to place staff, based on value as well as volume.
Did the change actually work?
Retail teams make constant changes: a campaign launches, a fixture moves, a window is refreshed, or a service routine changes. Without a measurement plan, the result is often discussed from memory after the fact.
Create a simple test loop:
Record what changed, where, and when.
Choose the relevant measure before the change goes live.
Define a suitable baseline or comparison period.
Review the result early enough to influence the next decision.
Seasonality, promotions, weather, trading hours, and other factors may affect the comparison. The goal is not to claim perfect causality from every store test. It is to make decisions using a more disciplined body of evidence.
DECISION IMPROVED
Whether to keep, scale, revise, or reverse the change.
What to ask a people counting vendor
Better decisions depend on trustworthy measurements. Any accuracy figure should come with context.
Ask prospective vendors:
What exactly does the accuracy percentage measure?
Under which store conditions was it tested?
How large and representative was the test sample?
Who carried out or verified the test?
How often is performance checked after installation?
Can the results be audited by a third party?
How is visitor data anonymized, governed, and documented?
Indivd applies one quality-assurance process across deployments. Its general claim is at least 97.5% counting accuracy in 99 out of 100 deployments. A separate customer-commissioned review, carried out using Indivd’s quality-assurance method, reported approximately 99% accuracy. These figures describe different scopes and should be presented as such. Results are retained for possible third-party review.
Visitor data is processed using Indivd’s patented anonymization approach, supported by a published Anonymization Policy and capability-specific Data Protection Impact Assessment (DPIA) guides.
From counting people to improving decisions
People counting technology will continue to evolve. The more important shift is how retailers organize the information it produces.
Start with the decision, then choose the measurement. Keep metrics that help teams attract the right visitors, improve the in-store experience, deploy staff more effectively, or test a change. Remove those that do not inform an action.
Used this way, foot traffic data becomes a practical tool for improving store performance, rather than another monthly report.
ACADEMIC SOURCES
Fader, P.S. (2011). Customer Centricity: Focus on the Right Customers for Strategic Advantage. Wharton Digital Press.
Fader, P.S., and Hardie, B.G.S. (2010). “Customer-Base Valuation in a Contractual Setting: The Perils of Ignoring Heterogeneity.” Marketing Science, 29(1), 85–93.
Grewal, D., Levy, M., and Kumar, V. (2009). “Customer Experience Management in Retailing: An Organizing Framework.” Journal of Retailing, 85(1), 1–14.
Hui, S.K., Bradlow, E.T., and Fader, P.S. (2009). “Testing Behavioral Hypotheses Using an Integrated Model of Grocery Store Shopping Path and Purchase Behavior.” Journal of Consumer Research, 36(3), 478–493.
Zhang, H., Li, L., and Burke, R.R. (2018). “Modeling the Effects of Dynamic Group Influence on Shopper Zone Choice, Purchase Conversion, and Spending.” Journal of the Academy of Marketing Science, 46(4), 532–555.