
Indivd
•
•
Intro
Profit is concentrating to fewer companies in stores, shopping centres and airports alike. What the winners have in common, and why the same divide matters for AI.
While the visit goes unmeasured, the money is moving, in all three rooms of the visitation economy. That is the short version of what has happened to the profit pools of retail, shopping centres and airports over the past decade, and the long version is worth an executive's full attention, because the pattern that emerges from it will also decide who gets a return on these industries' enormous AI investments.
The visitation economy, as the first article of this series defines it, is the market condition in which the visit itself is the product and visitors carry unequal value: nobody has to come anymore, every visit is chosen, and every visitor is worth something different.
This article is about the scoreboard: who is winning that economy, by how much, and what the winners have in common. Retail carries the best-documented version of the divide, so the story starts there; the centre and the airport follow, with their own numbers.
The concentration
McKinsey's analysis of 284 publicly traded retailers found that the top decile by revenue took 81% of retail's economic profit in the 2020 to 2023 period, up from 66% in 2010 to 2014 (McKinsey, 2024). Economic profit is a deliberately demanding measure: the value a company creates above its cost of capital. By that measure, one retailer in ten now takes four-fifths of everything the industry creates, and the share is still rising. At the other end, the same analysis found that one retailer in four now destroys value, up from one in six fifteen years earlier. The middle is thinning from both directions. Deloitte's parallel work points the same way: median return on assets across one hundred retailers fell by 340 basis points over 2012 to 2019, with declines in all eleven subsectors studied (MIT Sloan Management Review, 2021).
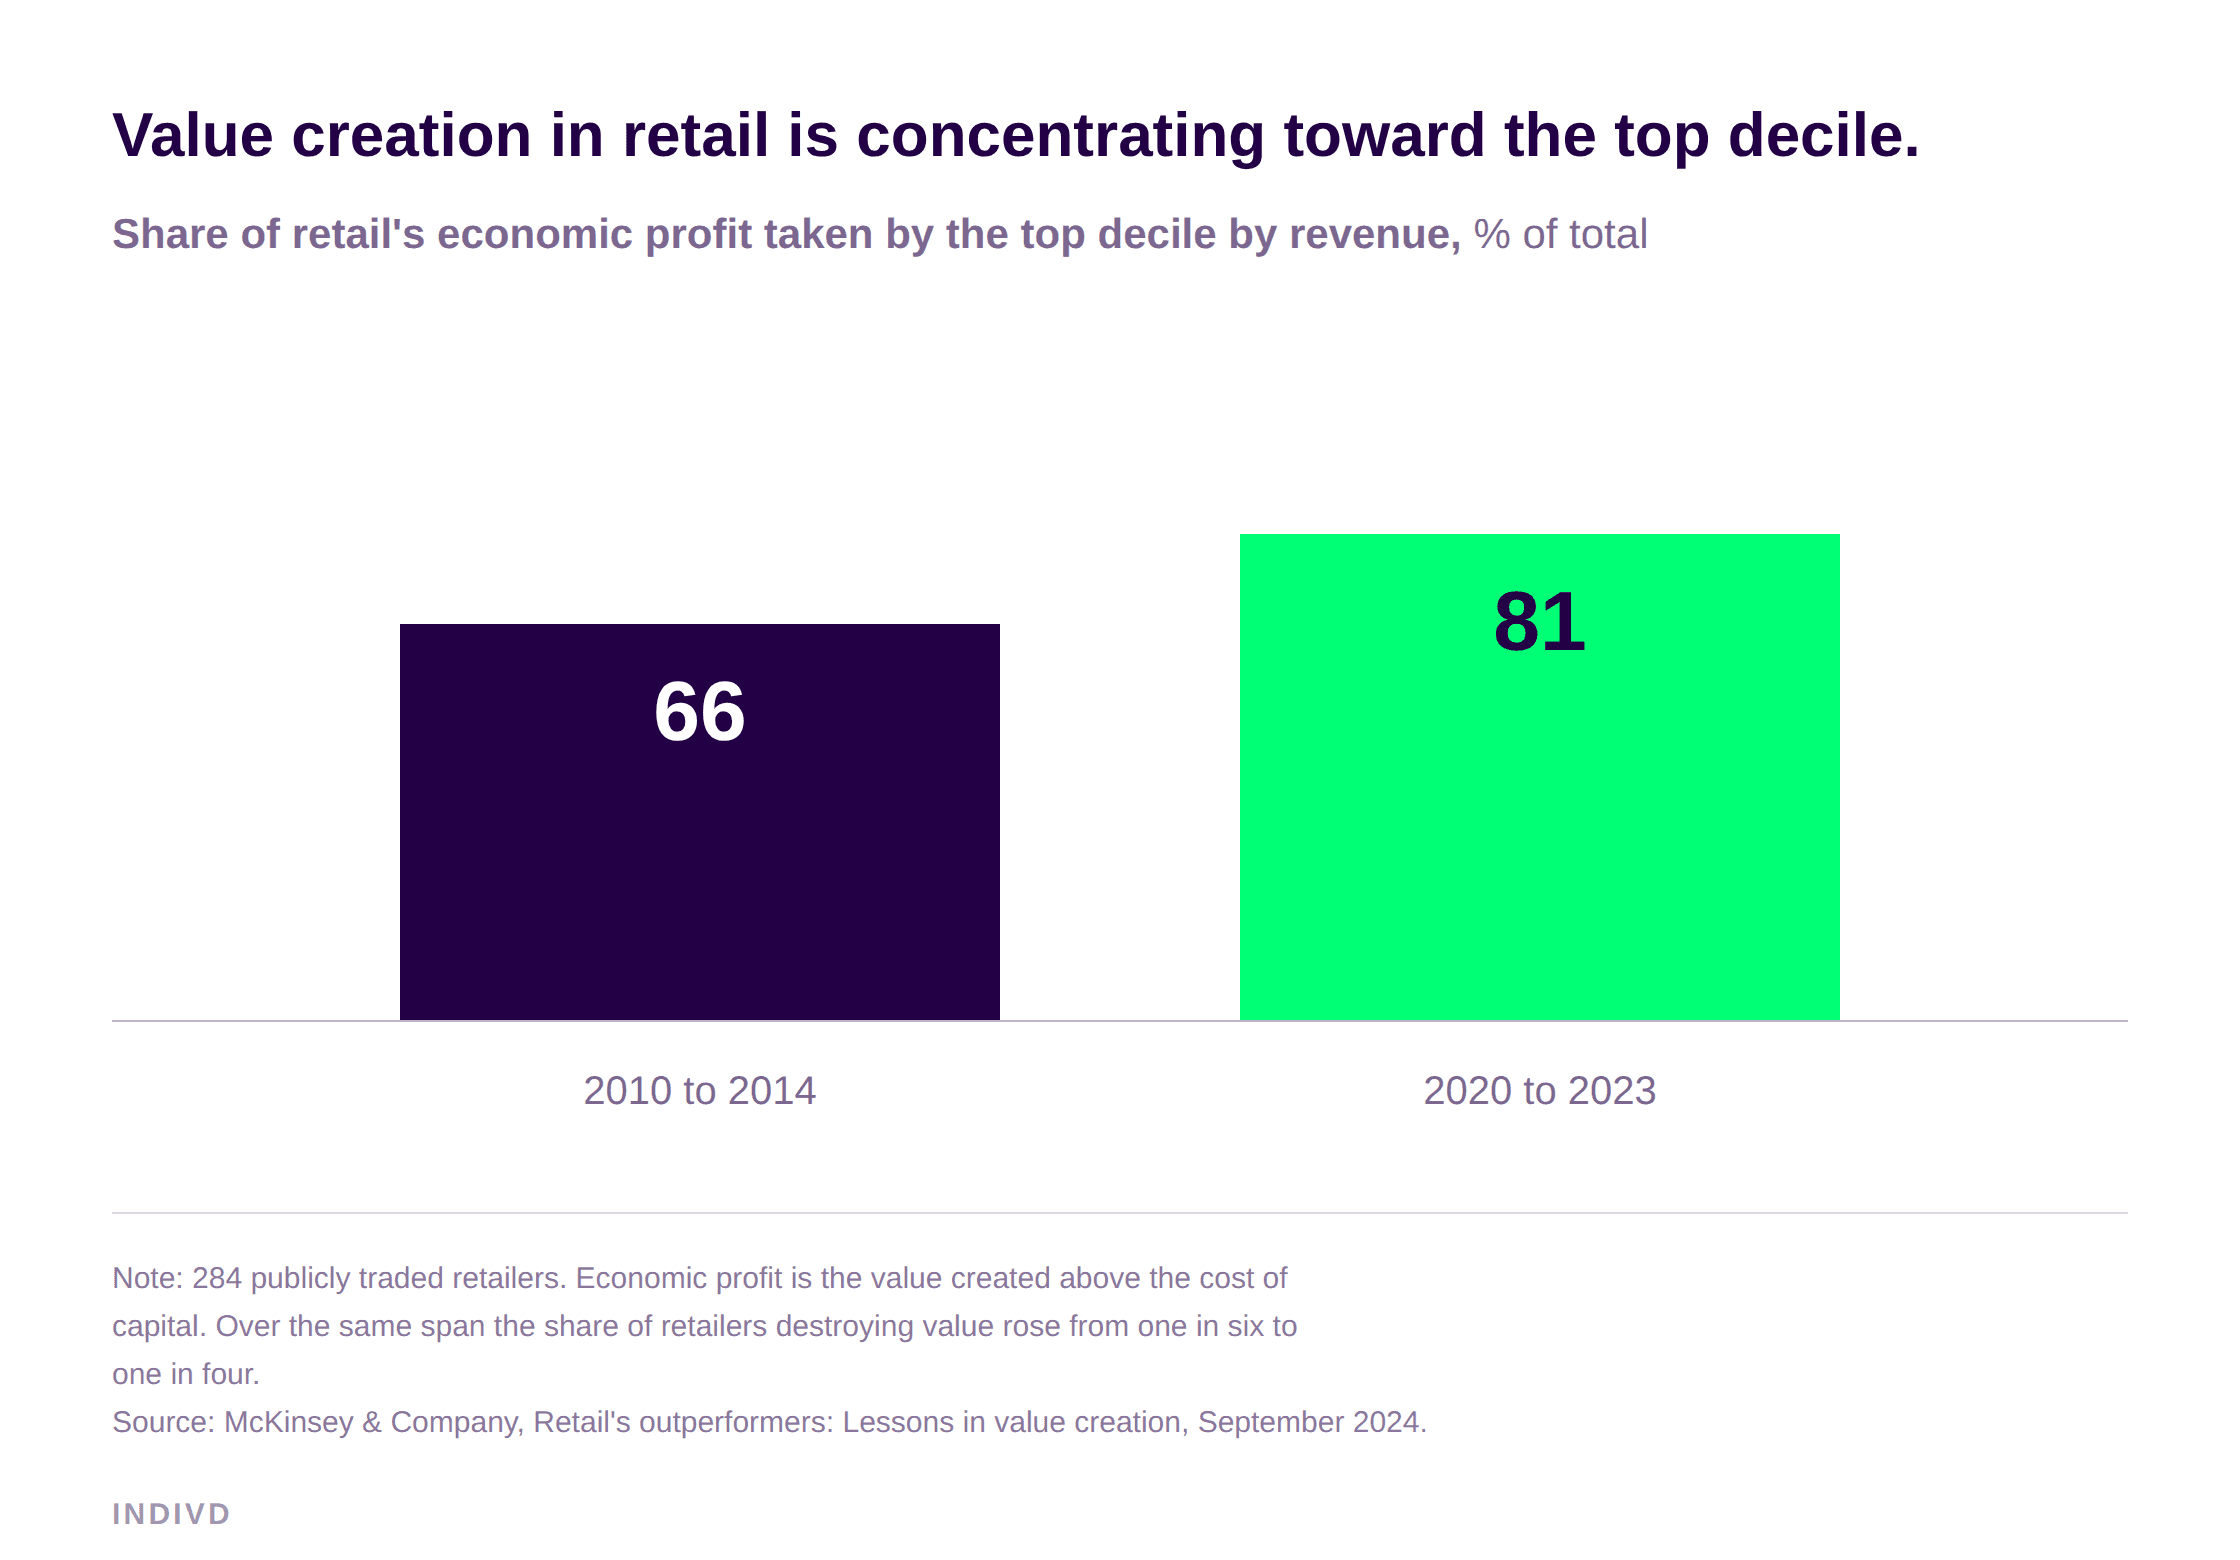
Is this simply scale? Partly, and McKinsey says so plainly: the top decile consists almost entirely of giants. But their analysis went a step further, studying the two dozen retailers, most with revenues under ten billion dollars, that climbed from outside the top quartile into it over the decade. McKinsey calls them movers, and the movers' traits are what should interest everyone else, because they describe a playbook rather than a birthright.
The winners' common trait
Read McKinsey's account of what the movers did, and one thread runs through it: they measure more of their business than their peers, and they act on what they measure. Data-driven merchandising. Personalization integrated into the store itself. Capital expenditure governed, in McKinsey's words, with a very clear understanding of short and long term ROI.
TAKEAWAY
The movers were three times more likely than non-winners to cut SG&A meaningfully, and nearly twice as likely to accelerate growth, but the mechanism underneath the numbers is the same in every case: decisions made on evidence, verified, and scaled only when they worked.
We would state the conclusion more directly than McKinsey does, and it should be read as our interpretation: the dividing line in the visitation economy is not who has data. Every retailer has receipts. It is whose data can answer why.
The same divide, in the shopping centre and the airport
Retail's concentration has an exact counterpart in the other two rooms of the visitation economy.
RESEARCH GROUNDING
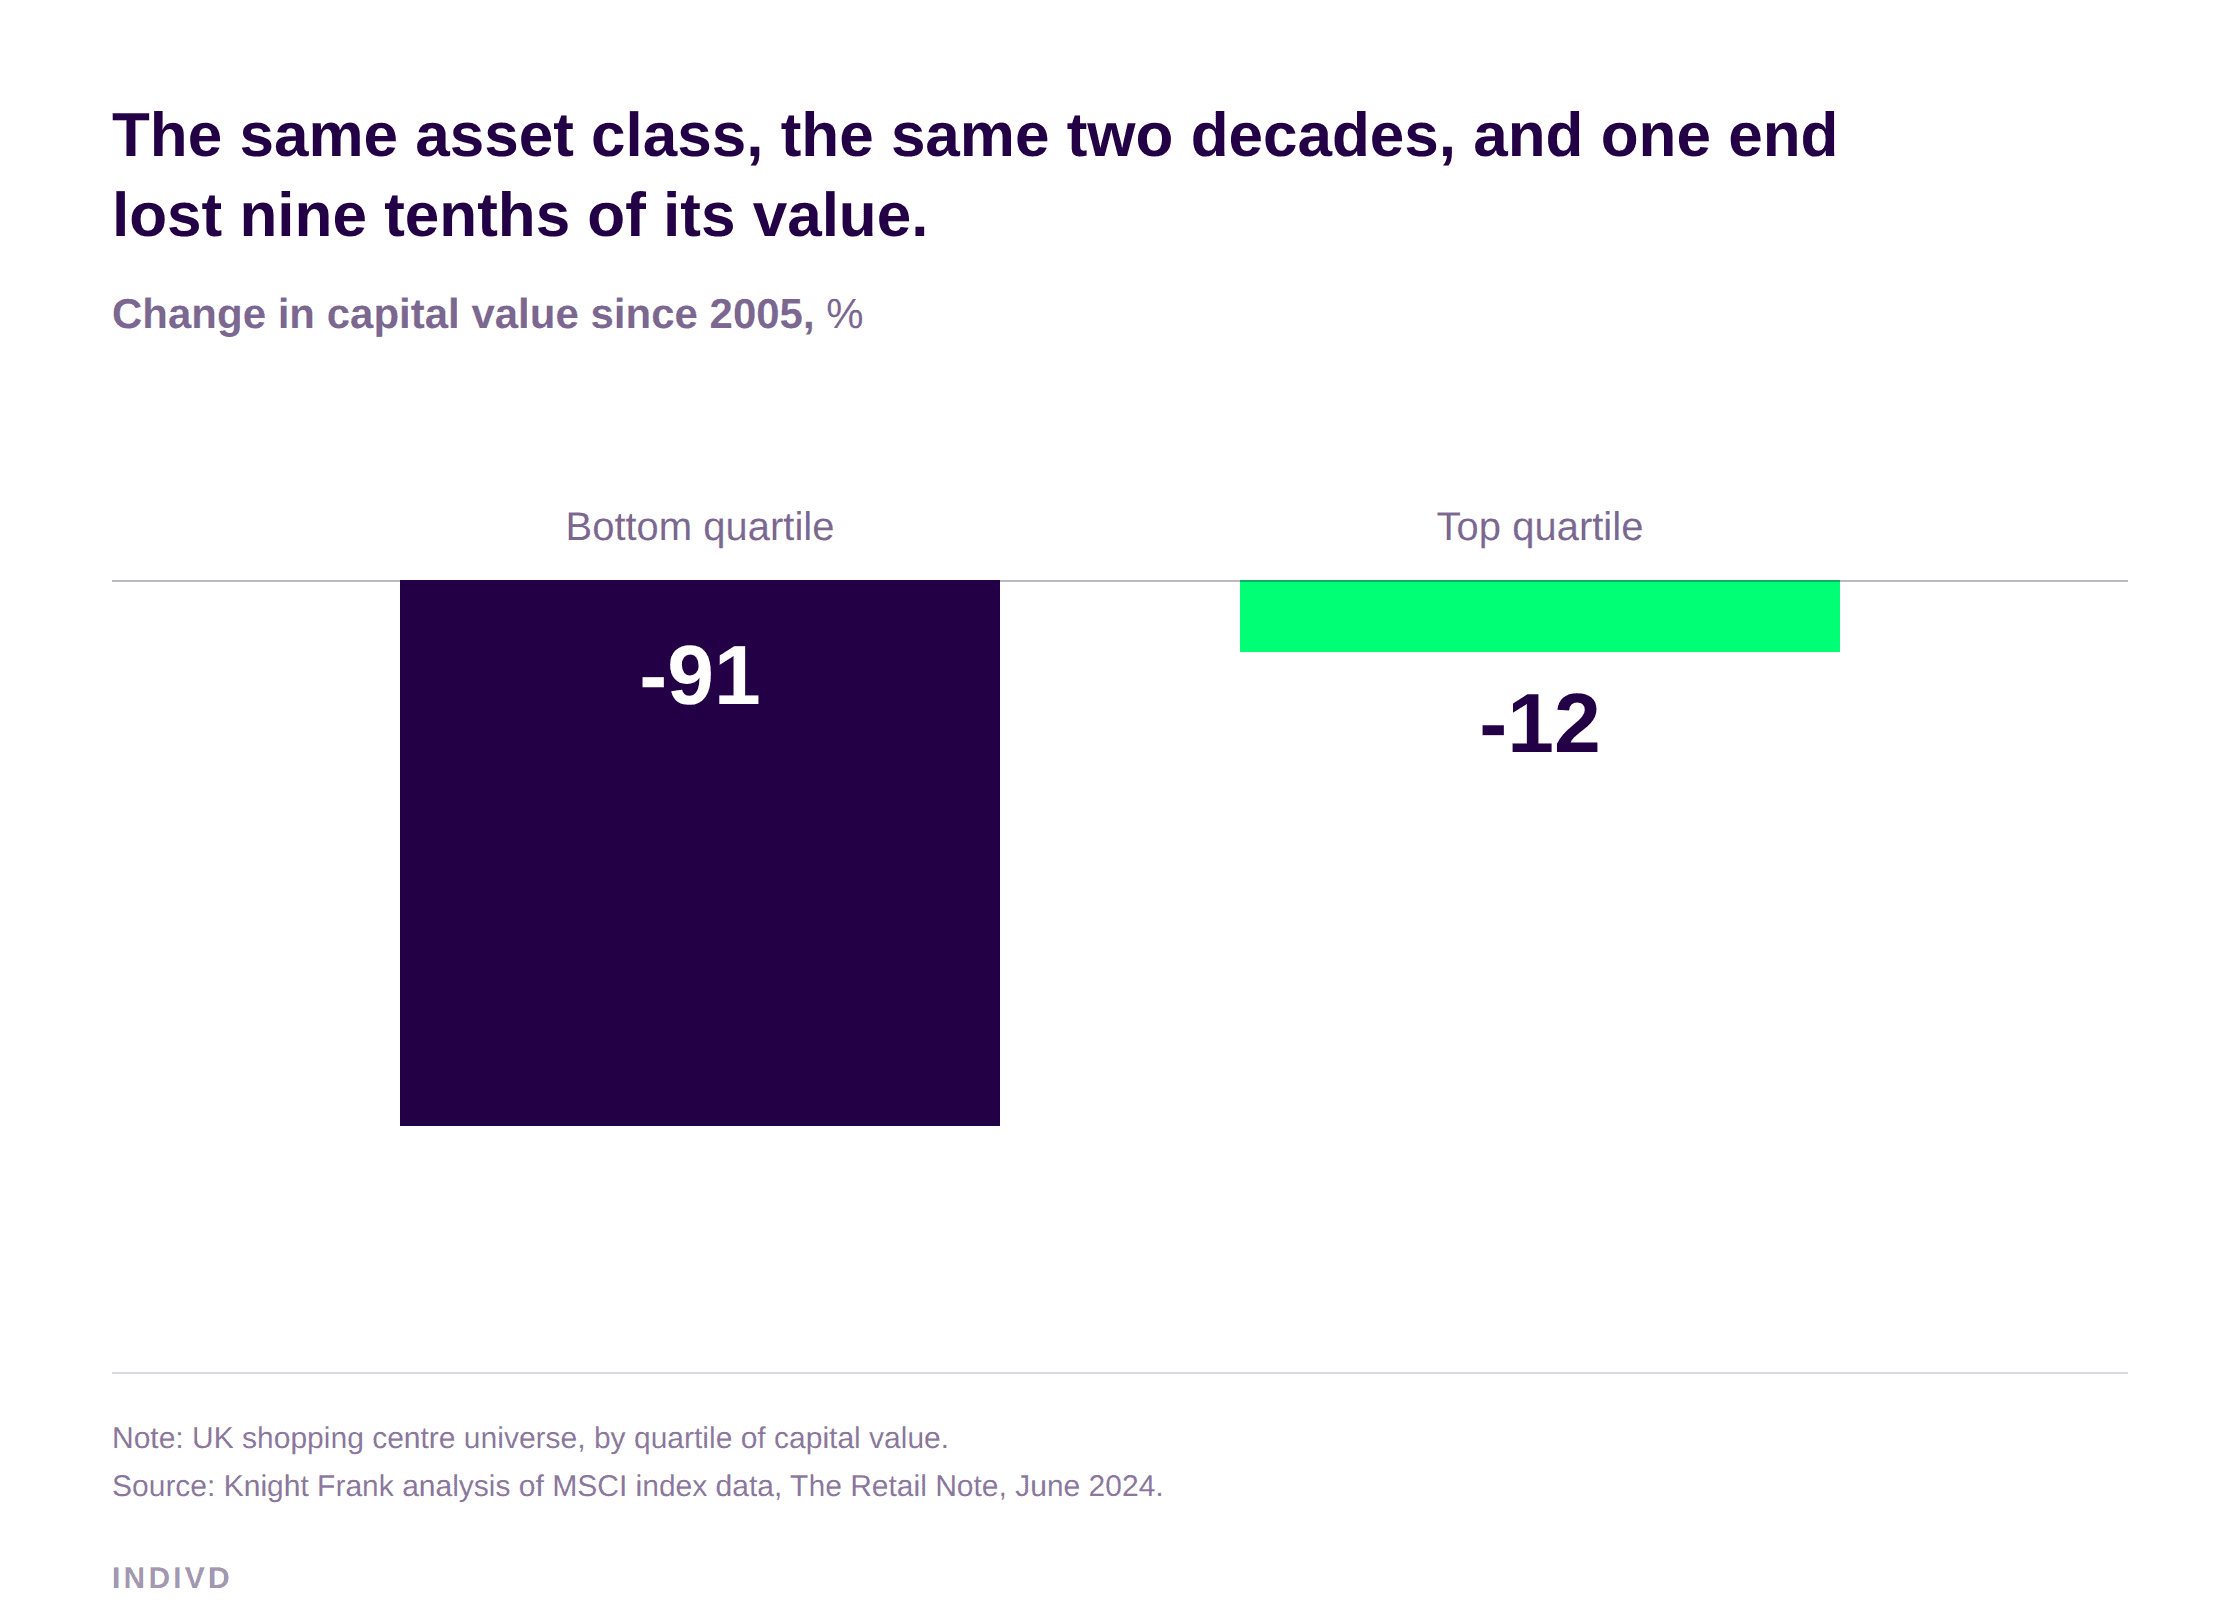
In the UK, the bottom quartile of shopping centres has lost 91% of its capital value since 2005, while the top quartile lost 12% (Knight Frank analysis of MSCI index data, 2024). The winning end looks like Klepierre, which closed 2025 at 97.1% occupancy with retailer sales up 3.4%, double the national retail sales indices in its markets (Klepierre, 2026).
Airports diverge the same way, on their own ratio. Paris's airside spend per passenger rose from 23.5 euros in 2019, restated like for like, to 31.7 euros in 2025, up roughly a third in nominal terms, while Frankfurt's net retail revenue per passenger was 3.28 euros in 2019 and 3.29 euros in 2025, flat in nominal terms across six years (Groupe ADP and Fraport annual results; the two ratios are defined differently, so each should be compared only with its own past). The industry-level decoupling is real, but it is not uniform, and the spread between operators is the airport industry's own divide.
The figures do not prove that one operating practice caused the divide. They do show why the visit has become the thing to understand. In every room, traffic alone explains less of the commercial outcome, while the operators pulling ahead build a more detailed record of what happens inside the visit and use it to make decisions.
The same divide now decides AI
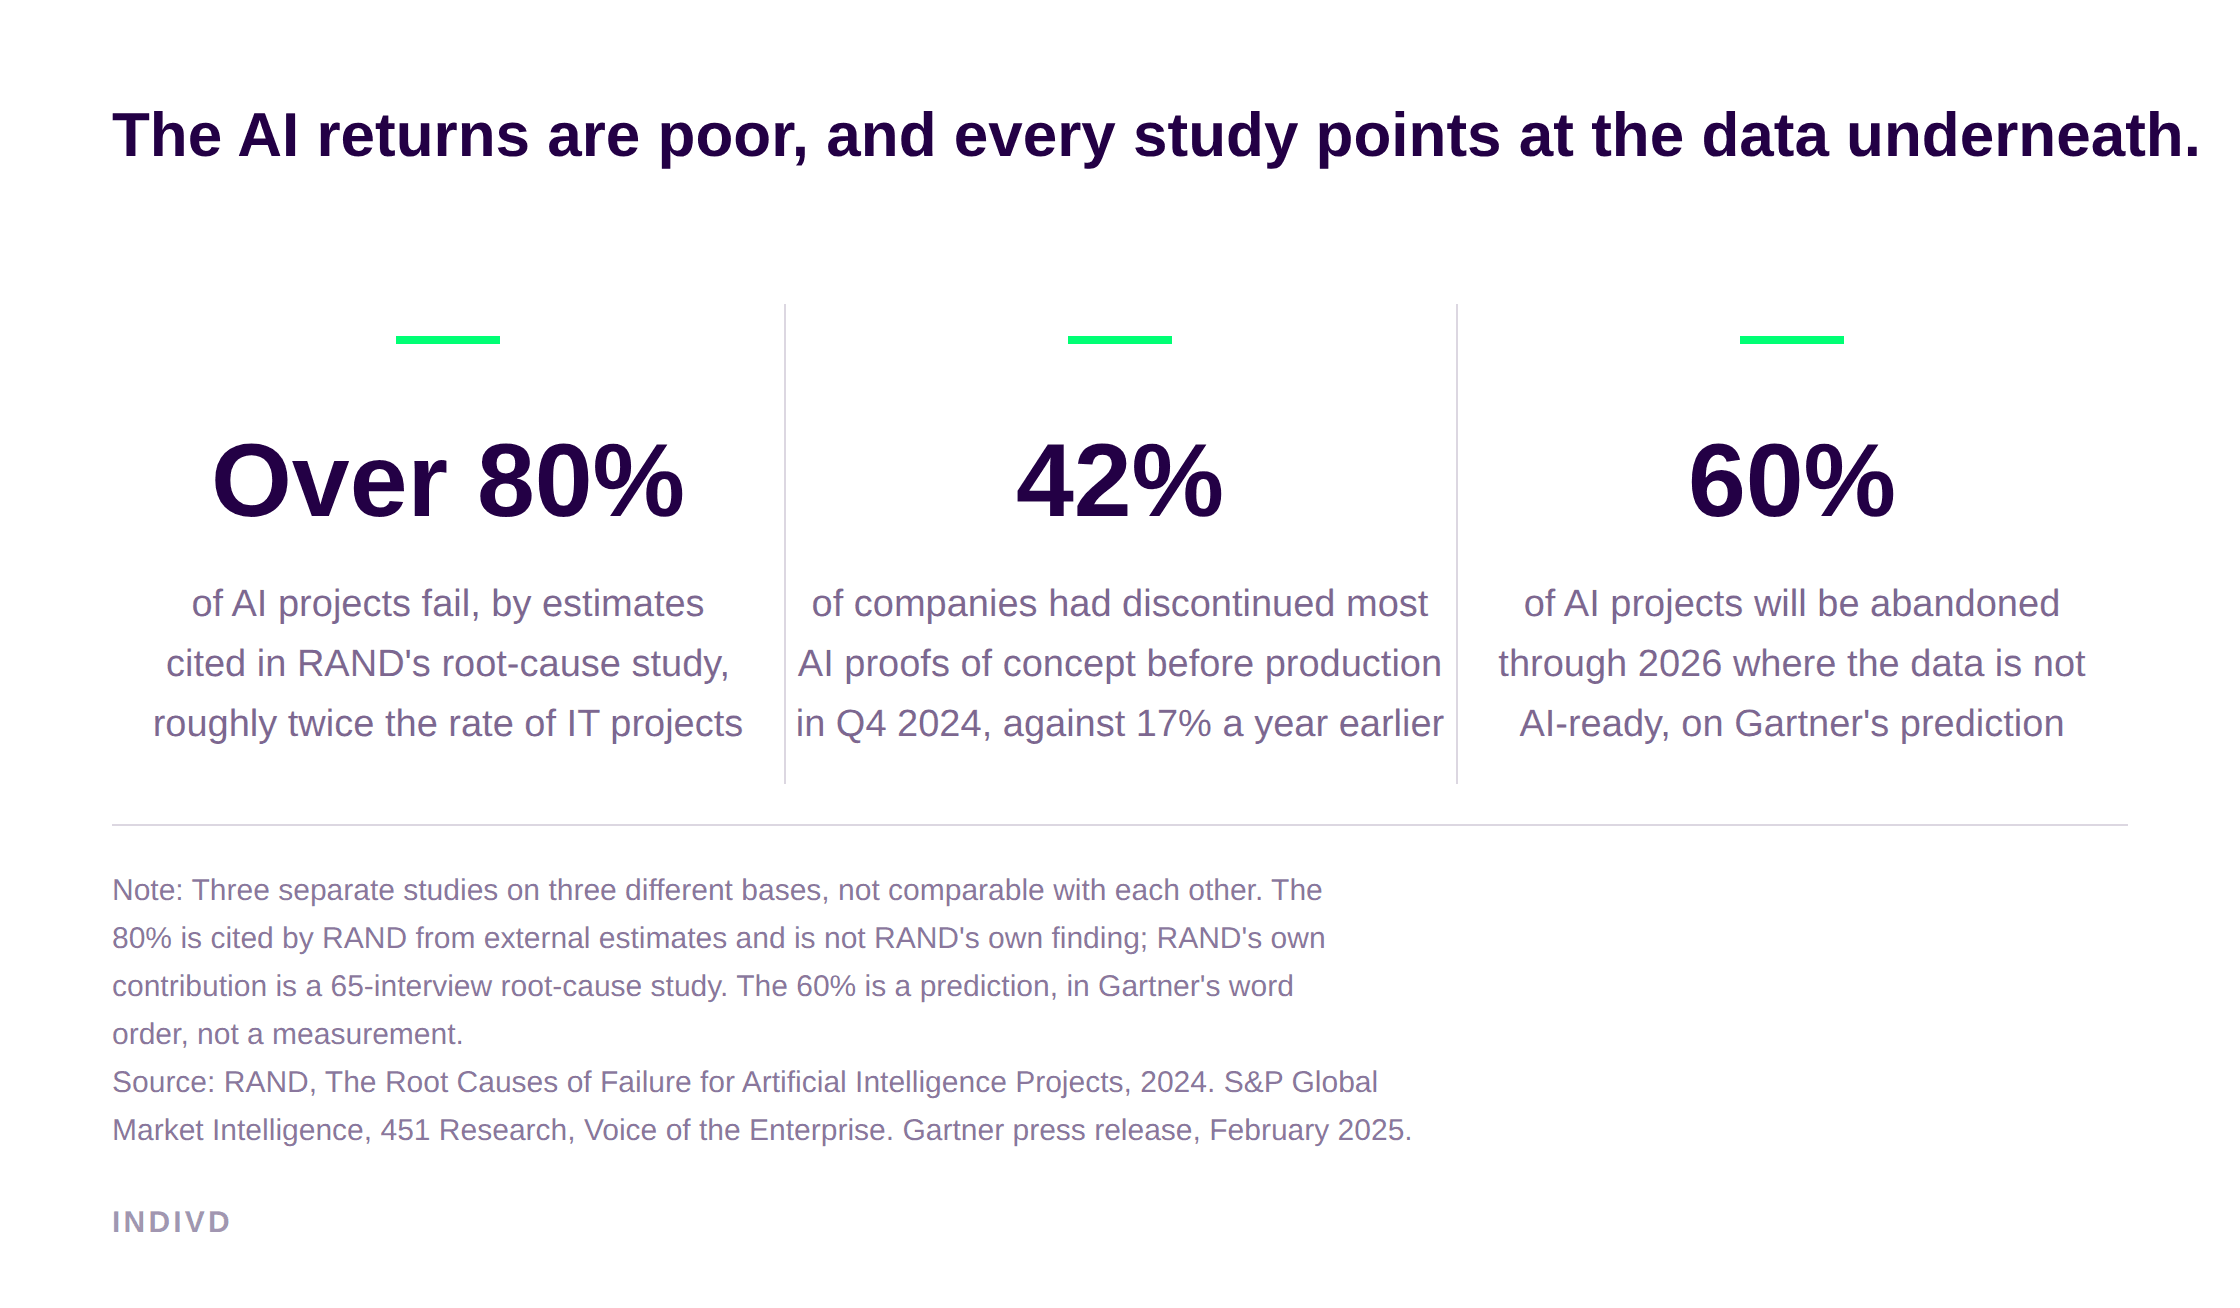
Here the story stops being historical. Retailers, landlords and airports are investing heavily in AI, and the early returns are sobering across every serious study: by estimates cited in RAND's root-cause study of AI failure, more than 80% of AI projects fail, roughly twice the rate of conventional IT projects, and S&P Global reports that by early 2025, in a survey of just over 1,000 companies in North America and Europe, 42% had abandoned most of their AI initiatives, up from 17% a year earlier.
RESEARCH GROUNDING
Gartner names the cause, and it deserves quoting precisely: through 2026, organizations will abandon 60% of AI projects unsupported by AI-ready data (Gartner, 2025). Not the models. The data.
Everyone is buying broadly the same AI; the models cannot be the divider. What differs is the record each operator's AI has to read, and for most, that record is the buying: receipts, reported tenant sales, concession statements. A perfect account of the people who paid, and silence about everyone else. AI pointed at that record answers the old questions faster. It does not answer new ones, because the answers were never written down.
ACADEMIC SOURCES
McKinsey & Company, "Retail's outperformers: Lessons in value creation", September 2024. Analysis of 284 publicly traded retailers. Link
"The Retail Profitability Paradox", Deloitte analysis published in MIT Sloan Management Review, June 2021. About 100 public retailers across 11 subsectors, median return on assets down 340 basis points over 2012 to 2019. Link
Knight Frank, "The Retail Note: Shopping centres, where did it all go wrong?", June 2024. Knight Frank analysis of MSCI index data. Link
Klepierre, FY 2025 earnings, February 2026. Occupancy 97.1%; like-for-like retailer sales up 3.4%, double the national retail sales indices in its markets.
Groupe ADP, full-year results. Extime Paris sales per passenger, airside spend divided by departing passengers, 23.5 euros in 2019 restated like for like to 31.7 euros in 2025.
Fraport, annual reports. Net retail revenue per passenger at Frankfurt, 3.28 euros in 2019 and 3.29 euros in 2025.
James Ryseff, Brandon F. De Bruhl and Sydne J. Newberry, "The Root Causes of Failure for Artificial Intelligence Projects and How They Can Succeed", RAND, 13 August 2024, RRA2680-1. Link
S&P Global Market Intelligence, 451 Research, Voice of the Enterprise: AI and Machine Learning, Use Cases 2025.
Gartner, "Lack of AI-Ready Data Puts AI Projects at Risk", press release, 26 February 2025. Link
Related reading
What is the visitation economy?
How to win the visitation economy