
Indivd
•
•
Intro
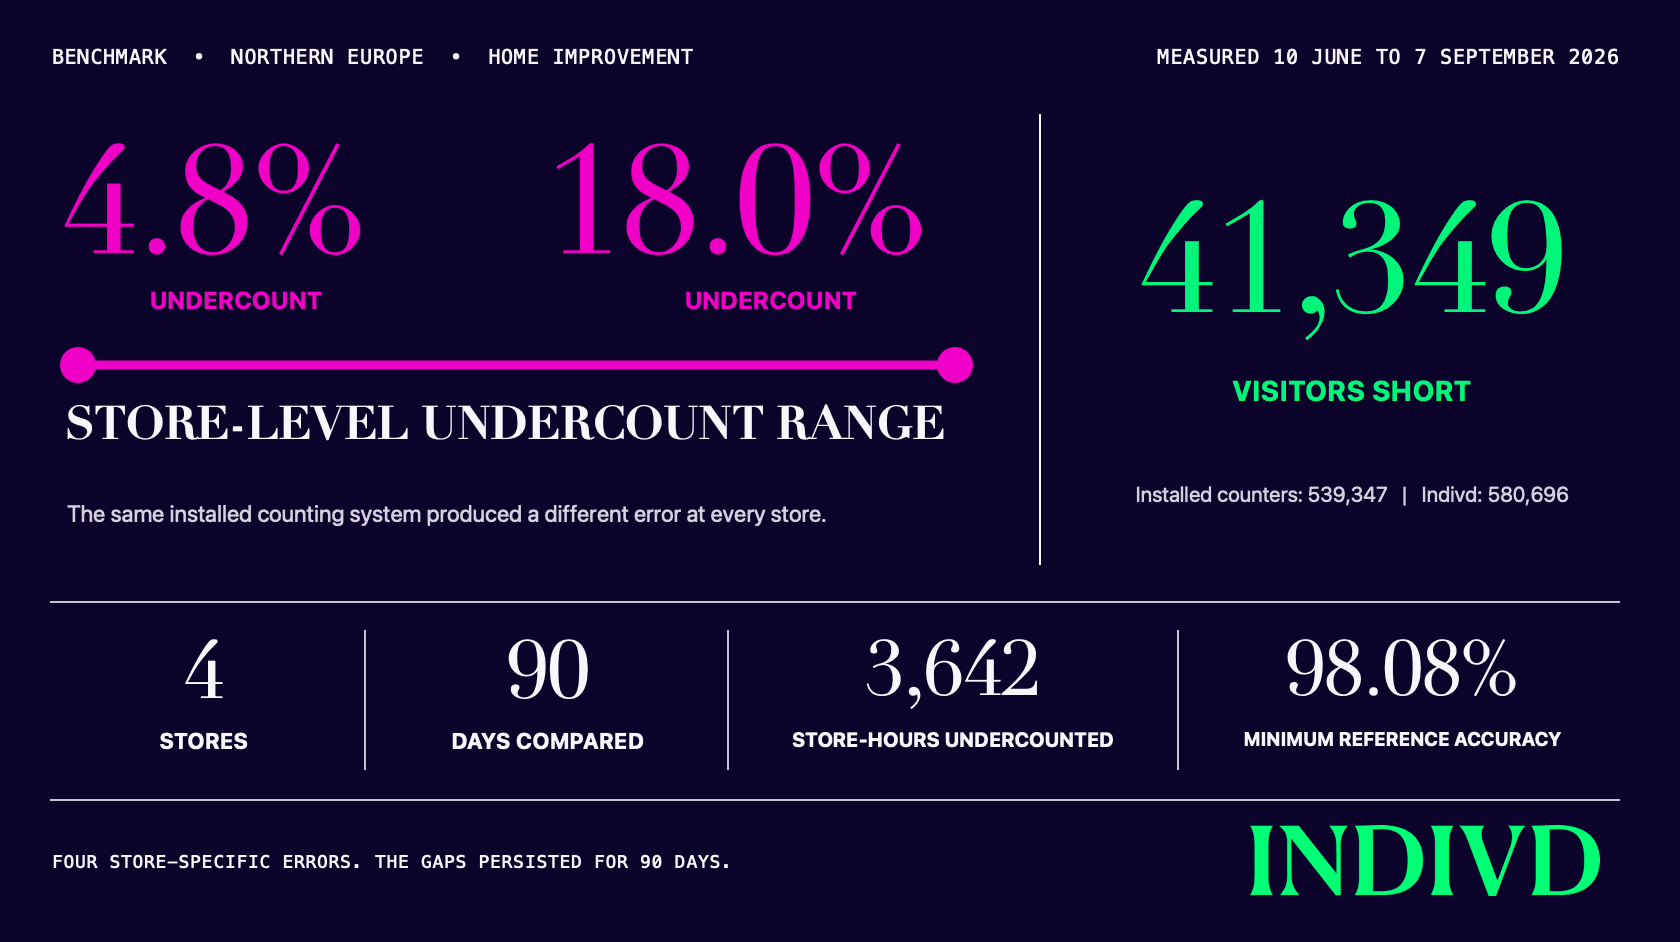
A 90-day benchmark across four Northern European home improvement stores found that installed counters undercounted by 4.8% to 18.0% at store level against Indivd’s validated AI-powered people-counting system, reporting 41,349 fewer visitors overall.
A home improvement retailer in Northern Europe compared its installed people counters with Indivd’s AI-based people-counting technology across four stores for 90 days. Indivd served as the reference, with its accuracy validated through manual quality assurance at every store.
Indivd recorded a reference total of 580,696 entering visitors. The installed counters reported 539,347, resulting in a shortfall of 41,349 visitors.
The difference changed through the trading day. The installed counters came closest to the reference between 08:00 and 10:00, when the aggregate undercount was 4%. Between 13:00 and 16:00, it doubled to 8%. It remained above the morning level for the rest of the measured day.
The size of the error depended on both the store and the hour.
The stores
Four locations, one system, four different errors
Home improvement stores present demanding conditions for people counting. Wide entrances, groups moving with trolleys, bulky purchases and changing traffic flows can all make visitors harder to detect consistently. Yet the visitor count remains the denominator beneath conversion rate and a direct input into staffing and store-performance analysis. Every decision built on that number inherits its accuracy.
The installed counters and the validated AI reference measured entering visitors during the same operating hours at four stores. The comparison covered 3,938 store-hours over 90 days.
Store | Reference count | Installed count | Net shortfall | Gap |
|---|---|---|---|---|
Store 1 | 138,876 | 129,781 | 9,095 | -6.5% |
Store 2 | 76,252 | 62,534 | 13,718 | -18.0% |
Store 3 | 127,418 | 120,312 | 7,106 | -5.6% |
Store 4 | 238,150 | 226,720 | 11,430 | -4.8% |
All four stores | 580,696 | 539,347 | 41,349 | -7.1% |
Every installed counter reported fewer visitors than the reference over the full period. No two stores were short by the same amount, and the largest store-level undercount was almost four times the smallest.
Retail chains often standardise on one counting technology so that locations can be evaluated on a common basis. In this benchmark, the same installed system produced a different level of undercount at every store. Using the same technology across the estate did not make the resulting visitor counts consistently comparable.
An earlier ten-day comparison at the same four stores found the same pattern over a shorter window.
The check
The gaps persisted throughout the 90-day comparison
A short comparison can reveal that two counting systems disagree. A longer comparison shows whether that difference is temporary or persists as visitor volumes and trading conditions change.
In this case, the undercount remained present at every store throughout the study.
Period | Store 1 | Store 2 | Store 3 | Store 4 | All stores |
|---|---|---|---|---|---|
June | -5.2% | -19.1% | -3.5% | -4.9% | -6.5% |
July | -7.4% | -17.9% | -6.3% | -5.0% | -7.5% |
August | -6.8% | -17.8% | -6.3% | -4.6% | -7.3% |
September | -6.1% | -15.4% | -5.5% | -4.1% | -6.3% |
Full period | -6.5% | -18.0% | -5.6% | -4.8% | -7.1% |
The study ran from 10 June to 7 September 2026, so the June and September figures cover partial months.
Store 2 remained close to an 18% undercount for most of the period. The other three stores produced smaller gaps, but those gaps were also persistent and specific to each location.
The totals remained plausible throughout the study. Nothing in the installed counters’ own data indicated that 41,349 visitors were missing.
Sales data can be reconciled against transactions and payments. People-counting data has no equivalent internal control. Unless the count is compared with a validated reference, the number reported by the system becomes the number the business accepts as true.
Establishing the reference
Indivd’s AI-based people-counting technology served as the reference. It was validated against manual counts before the comparison began. The absolute accuracy was 98.08% or higher at every store included in the study. Read more about how Indivd verifies data accuracy.
This validation step is essential. Without it, a benchmark shows only that two systems disagree. It does not establish which one is closer to the actual number of visitors. The same questions should be asked when assessing how any people-counting accuracy claim was tested.
DEFINITION
Absolute accuracy is calculated as 100% minus the absolute error rate. Missed visitors and falsely added visitors are counted as separate errors, so errors in opposite directions cannot cancel each other out.
This is stricter than a net measure. Under a net calculation, a system that misses 40 visitors and adds 40 false visitors can appear to have no error. Under an absolute calculation, it has made 80 counting errors.
The trading day
The size of the error changed by hour
The 90-day result was not one fixed percentage repeating throughout the day. The difference between the installed counters and the reference changed by hour and by store.
Hour | Store 1 | Store 2 | Store 3 | Store 4 | All stores |
|---|---|---|---|---|---|
07:00 - 08:00 | -7% | -8% | -3% | -5% | |
08:00 - 09:00 | -5% | -3% | -3% | -4% | |
09:00 - 10:00 | -5% | -4% | -4% | -4% | |
10:00 - 11:00 | -6% | -18% | -6% | -5% | -7% |
11:00 - 12:00 | -7% | -18% | -5% | -5% | -7% |
12:00 - 13:00 | -6% | -17% | -5% | -4% | -7% |
13:00 - 14:00 | -7% | -18% | -6% | -5% | -8% |
14:00 - 15:00 | -7% | -18% | -6% | -5% | -8% |
15:00 - 16:00 | -8% | -19% | -7% | -5% | -8% |
16:00 - 17:00 | -5% | -19% | -4% | -5% | -7% |
17:00 - 18:00 | -5% | -18% | -5% | -4% | -6% |
18:00 - 19:00 | -6% | -17% | -5% | -6% | -7% |
19:00 - 20:00 | -9% | -13% | -9% | -4% | -8% |
All hours | -7% | -18% | -6% | -5% | -7% |
A blank cell means that no measurement was available for that store and hour. It does not represent a zero gap.
Across all four stores, the installed counters came closest to the reference between 08:00 and 10:00, when the aggregate undercount was 4%. The gap doubled to 8% between 13:00 and 16:00 and returned to 8% during the final measured hour.
Each store also followed its own hourly pattern. Store 3 ranged from a 3% to a 9% undercount, while Store 4 remained between 3% and 6%. Store 2 recorded the largest hourly gaps, reaching 19% during parts of the afternoon.
The installed system undercounted in 3,642 of the 3,938 measured store-hours. It overcounted in 170 store-hours and matched the reference in the remaining 126.
What the number carries
An inaccurate denominator can make the wrong store look strongest
Visitor count is the denominator used to calculate conversion rate and sales per visitor. It is also a direct input into retail people counting and foot traffic analytics, including staffing models, campaign analysis and comparisons between stores.
When visitor numbers are understated, reported conversion rises even if the store makes no additional sales.
Consider a store with 100 visitors and 10 transactions. Its true conversion rate is 10%. If the counter records only 82 visitors, reported conversion becomes 12.2%. The store appears to perform about 22% better without completing one additional transaction.
That example illustrates the effect of an 18% undercount. It does not use the retailer’s sales figures.
Different counting errors can also change the ranking of stores. A location may appear to convert better because its counter misses more visitors, not because its team converts a greater share of the people who enter.
The same distortion can affect:
Store conversion comparisons
Sales per visitor
Visitors per staffed hour
Hourly staffing decisions
Campaign measurement
Investment and closure assessments
These calculations can remain mathematically correct while still producing misleading conclusions. The denominator must therefore be tested independently.
Across the four stores, the aggregate shortfall was 41,349 visitors. Applying the combined 7.1% gap as a single correction factor would not solve the problem. Store 2 would remain materially undercounted, while Store 4 would be adjusted beyond its reference total.
The benchmark therefore revealed two distinct issues. The size of the error differed by store, and the error within each store changed through the day. There was no single correction factor that could make all four locations consistently comparable.
In a separate engagement, KPMG audited Indivd’s counting accuracy at a major retailer’s store against manual ground truth. Every camera tested came within 1.17%, the strongest result among the systems included in that audit.
Common questions
How accurate are retail people counters?
Retail people-counter accuracy varies by technology, installation, store environment and time of day. It should be measured against a validated reference rather than inferred from the counter’s own data. In this benchmark, one installed counting system undercounted by between 4.8% and 18.0% across four stores.
What causes a people counter to undercount visitors?
People counters can be affected by wide entrances, groups crossing together, trolleys, bulky purchases, partial obstruction, changing traffic patterns and insufficient sensor coverage. This benchmark measured the size and timing of the errors but did not isolate the technical cause at each store.
How do inaccurate footfall counts affect retail conversion rates?
Retail conversion rate is calculated by dividing transactions by visitor count. If a footfall counter misses visitors, the denominator becomes too small and the reported conversion rate becomes too high. For example, 10 transactions from 100 visitors produce a 10% conversion rate. If the counter records only 82 visitors, the reported rate rises to 12.2% without any increase in sales.
How should people-counting accuracy be tested?
The system count should be compared with a validated ground-truth count of the same entrances, directions and operating hours. Testing should cover enough locations and time periods to reveal whether accuracy changes by store, hour or traffic condition. Absolute errors should be measured separately so that missed visitors and falsely added visitors cannot cancel each other out.
What is AI people counting?
AI people counting uses computer vision to detect and count people crossing a defined entrance or counting line. In this benchmark, the AI-based reference was validated against manual counts at every store. The use of AI alone does not guarantee accuracy, so any people-counting system should be tested under real operating conditions.
Can a third party verify Indivd's counting accuracy?
Yes. The customer selects the locations, dates and hours used for validation. The check can be conducted without Indivd present, and the same documented method can be provided to an independent third party. This allows the reported accuracy to be tested against manual ground truth under the customer’s own operating conditions.